How to Open Analytics
- Open your app in the builder.
- Click the Analytics icon (bar chart) in the left sidebar.
Overview
At the top of the dashboard you’ll see key metrics at a glance:- Visitors - total unique visitors to your app, with a percentage change indicator
- Revenue - revenue generated from your app (coming soon)
- Bounce rate - percentage of visitors who leave without interacting
- Session time - average time visitors spend in your app
- Online - number of visitors currently on your app in real time
Visitor Trend Chart
Below the metrics, a line chart shows your visitor traffic over the selected time range so you can spot trends and peaks at a glance.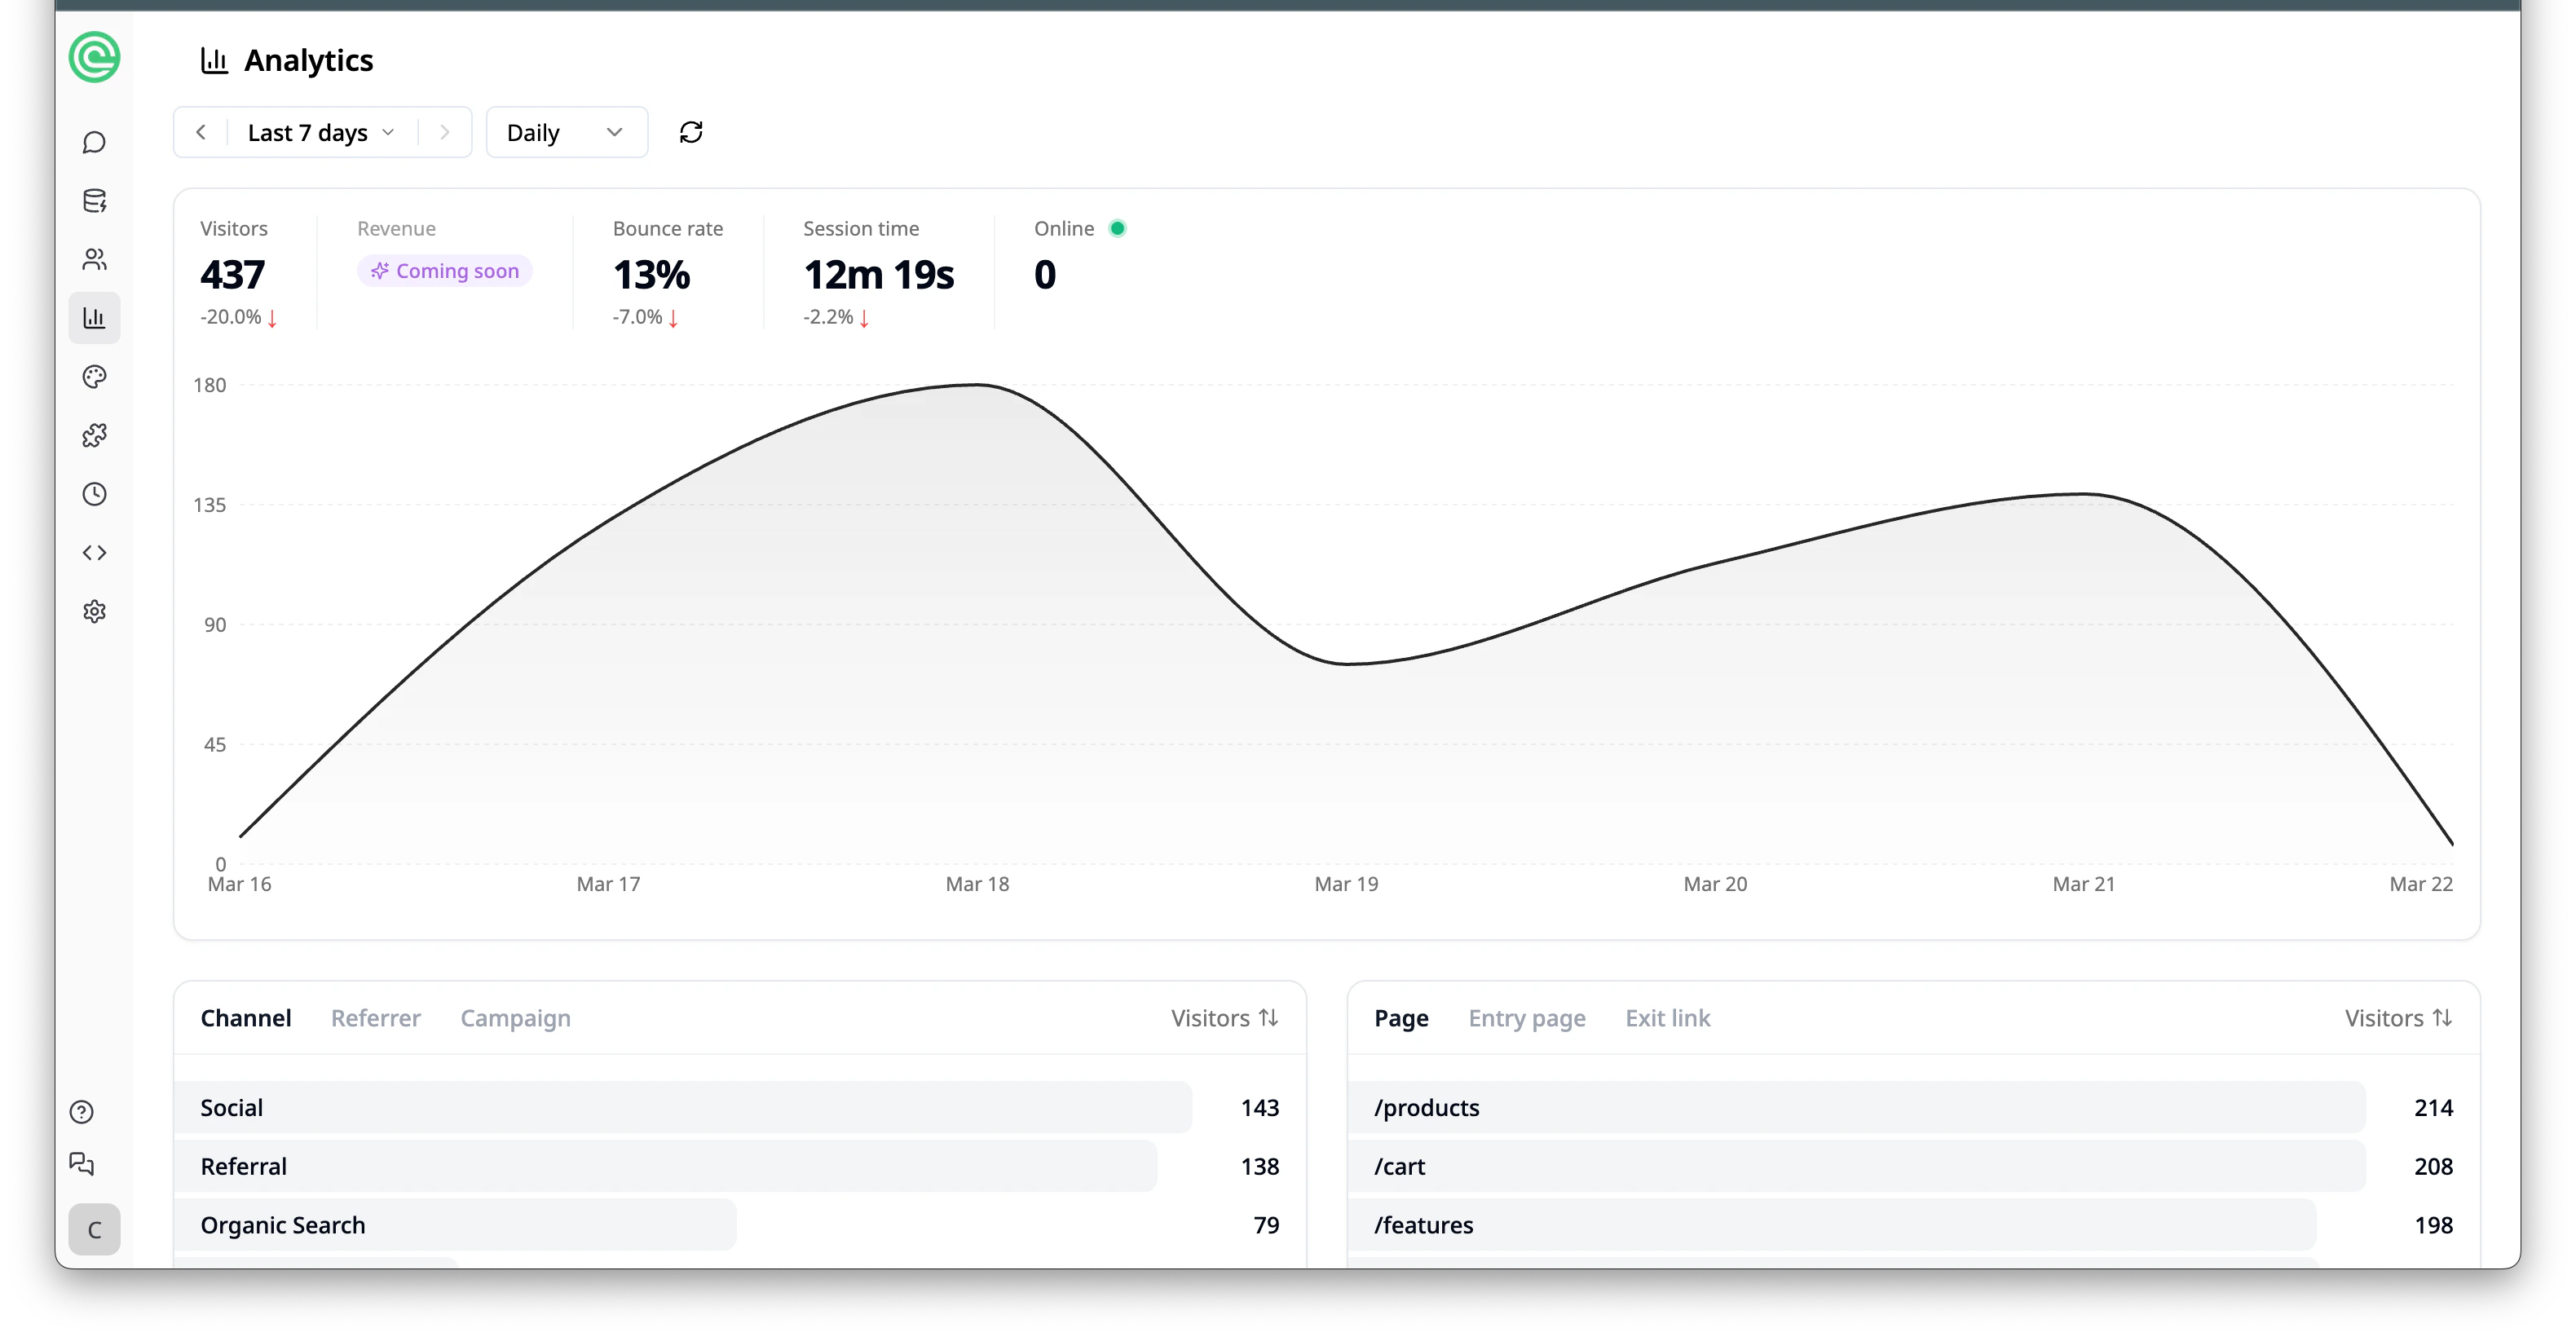
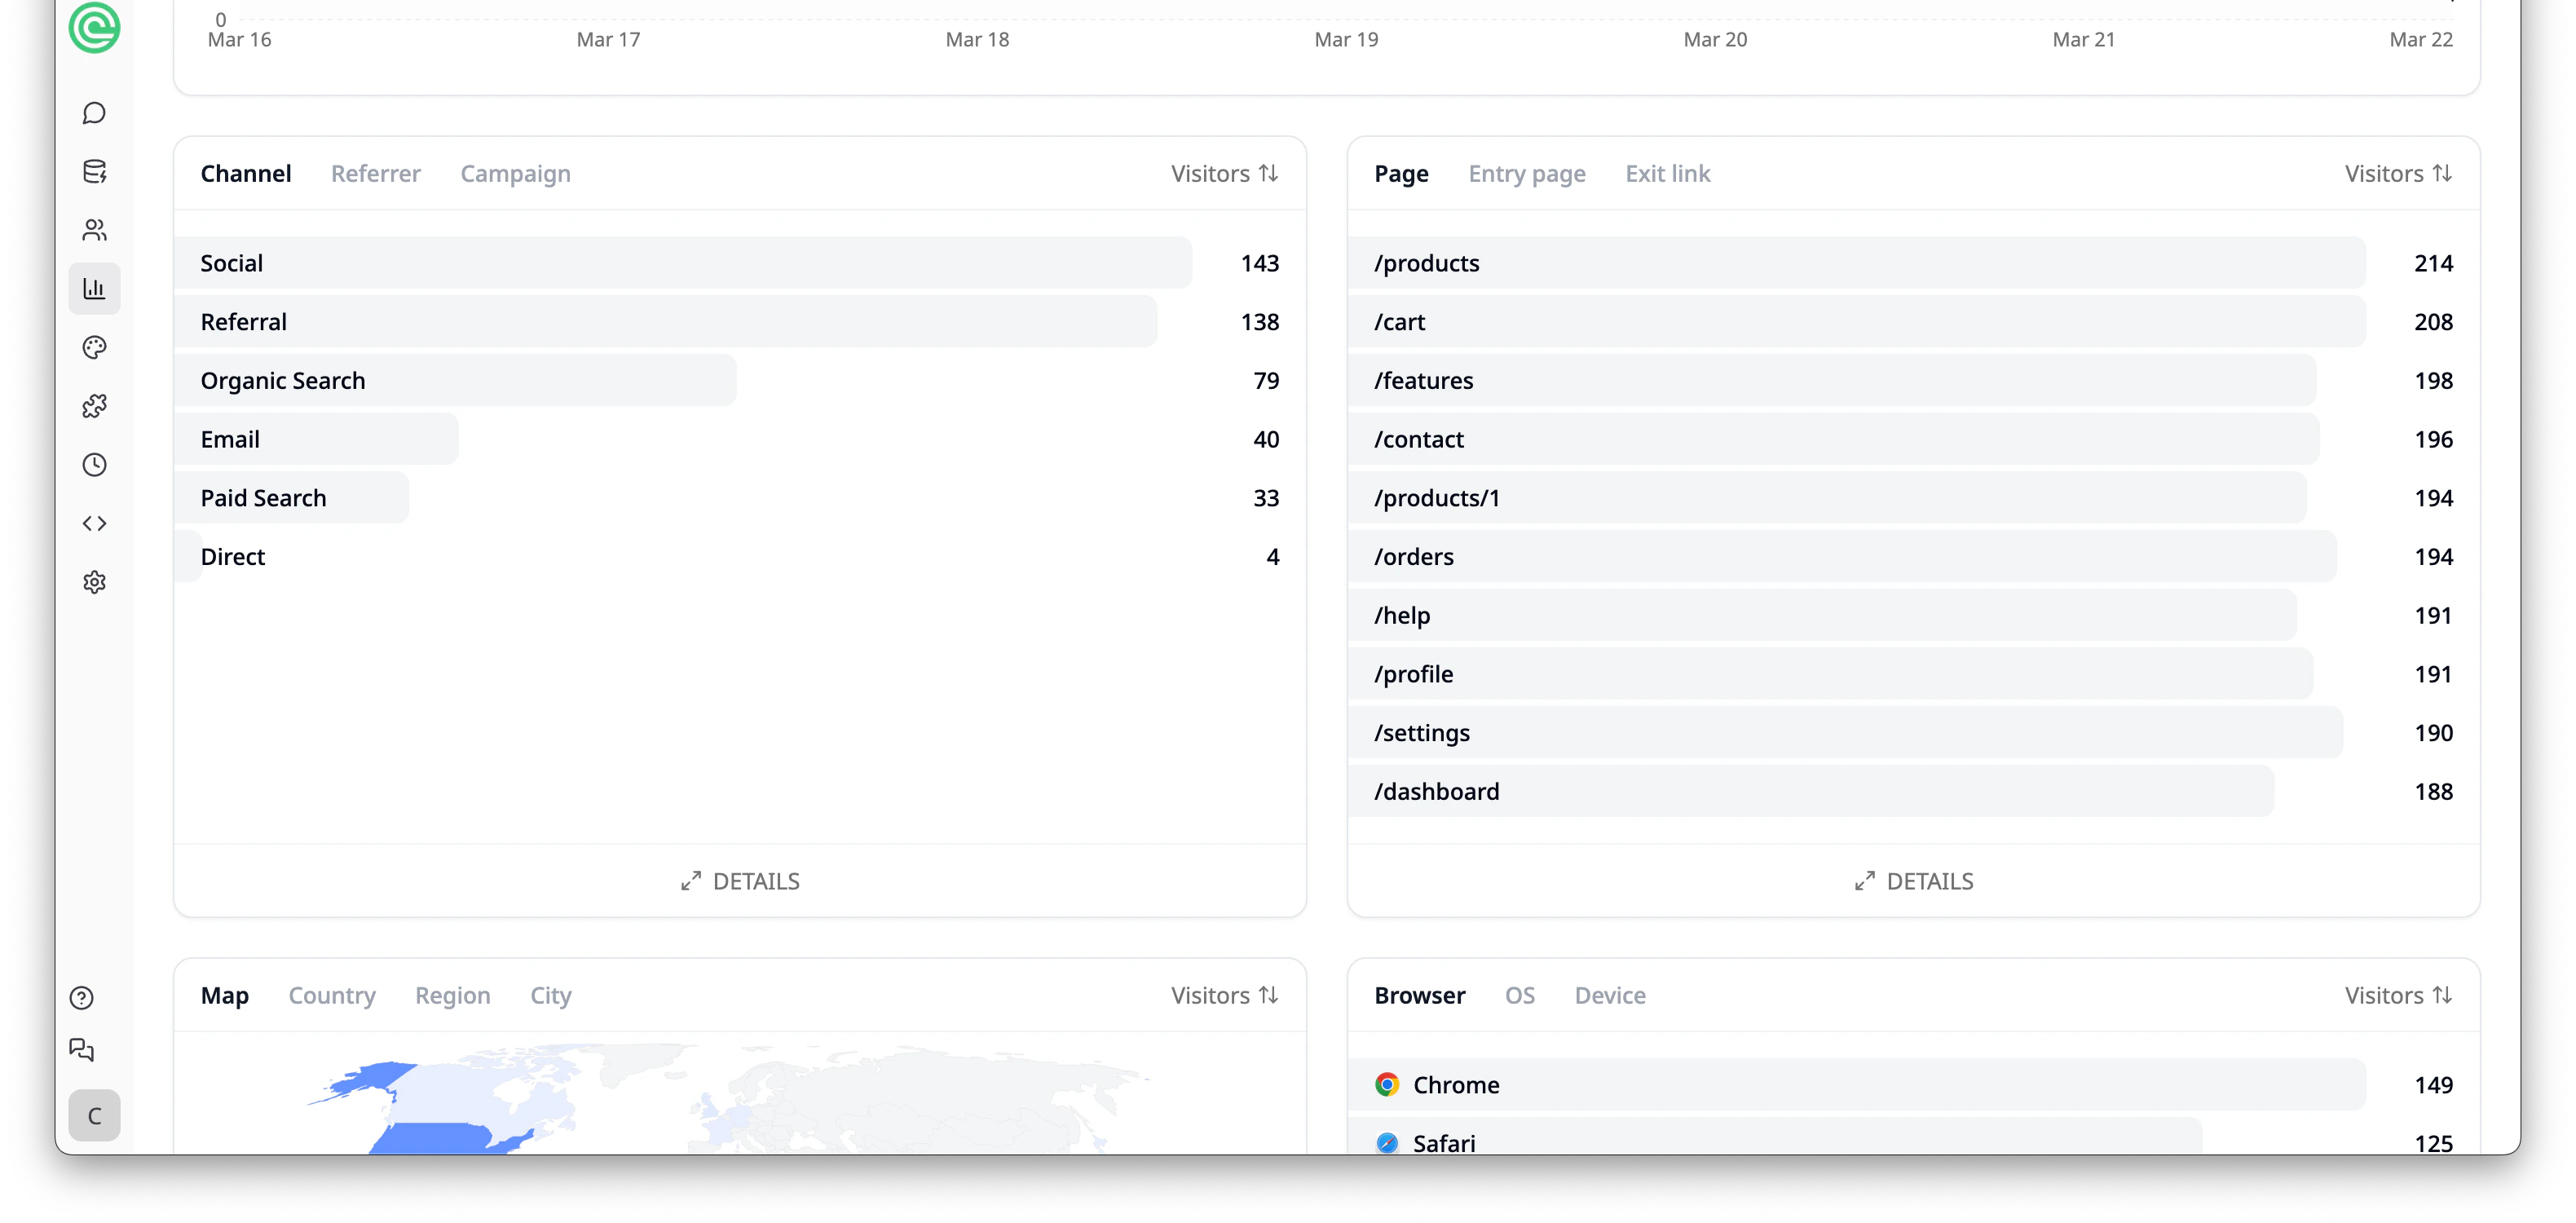
Channels
The Channel section breaks down where your traffic comes from:- Social - visitors from social media platforms
- Referral - visitors from other websites linking to your app
- Organic Search - visitors who found your app through search engines
- Email - visitors from email campaigns
- Paid Search - visitors from paid search ads
- Direct - visitors who typed your app URL directly
Pages
The Page section shows which pages in your app get the most visits. Switch between:- Page - all pages ranked by visitor count
- Entry page - the first page visitors land on
- Exit link - outbound links visitors click to leave your app
Geography
The Map section displays a world map highlighting where your visitors are located. Switch between:- Map - visual geographic distribution
- Country - visitors broken down by country
- Region - visitors broken down by region
- City - visitors broken down by city
Browsers & Devices
The Browser section shows which browsers your visitors use (e.g. Chrome, Safari, Edge, Samsung Internet, Firefox). Switch between:- Browser - breakdown by browser
- OS - breakdown by operating system
- Device - breakdown by device type (desktop, mobile, tablet)
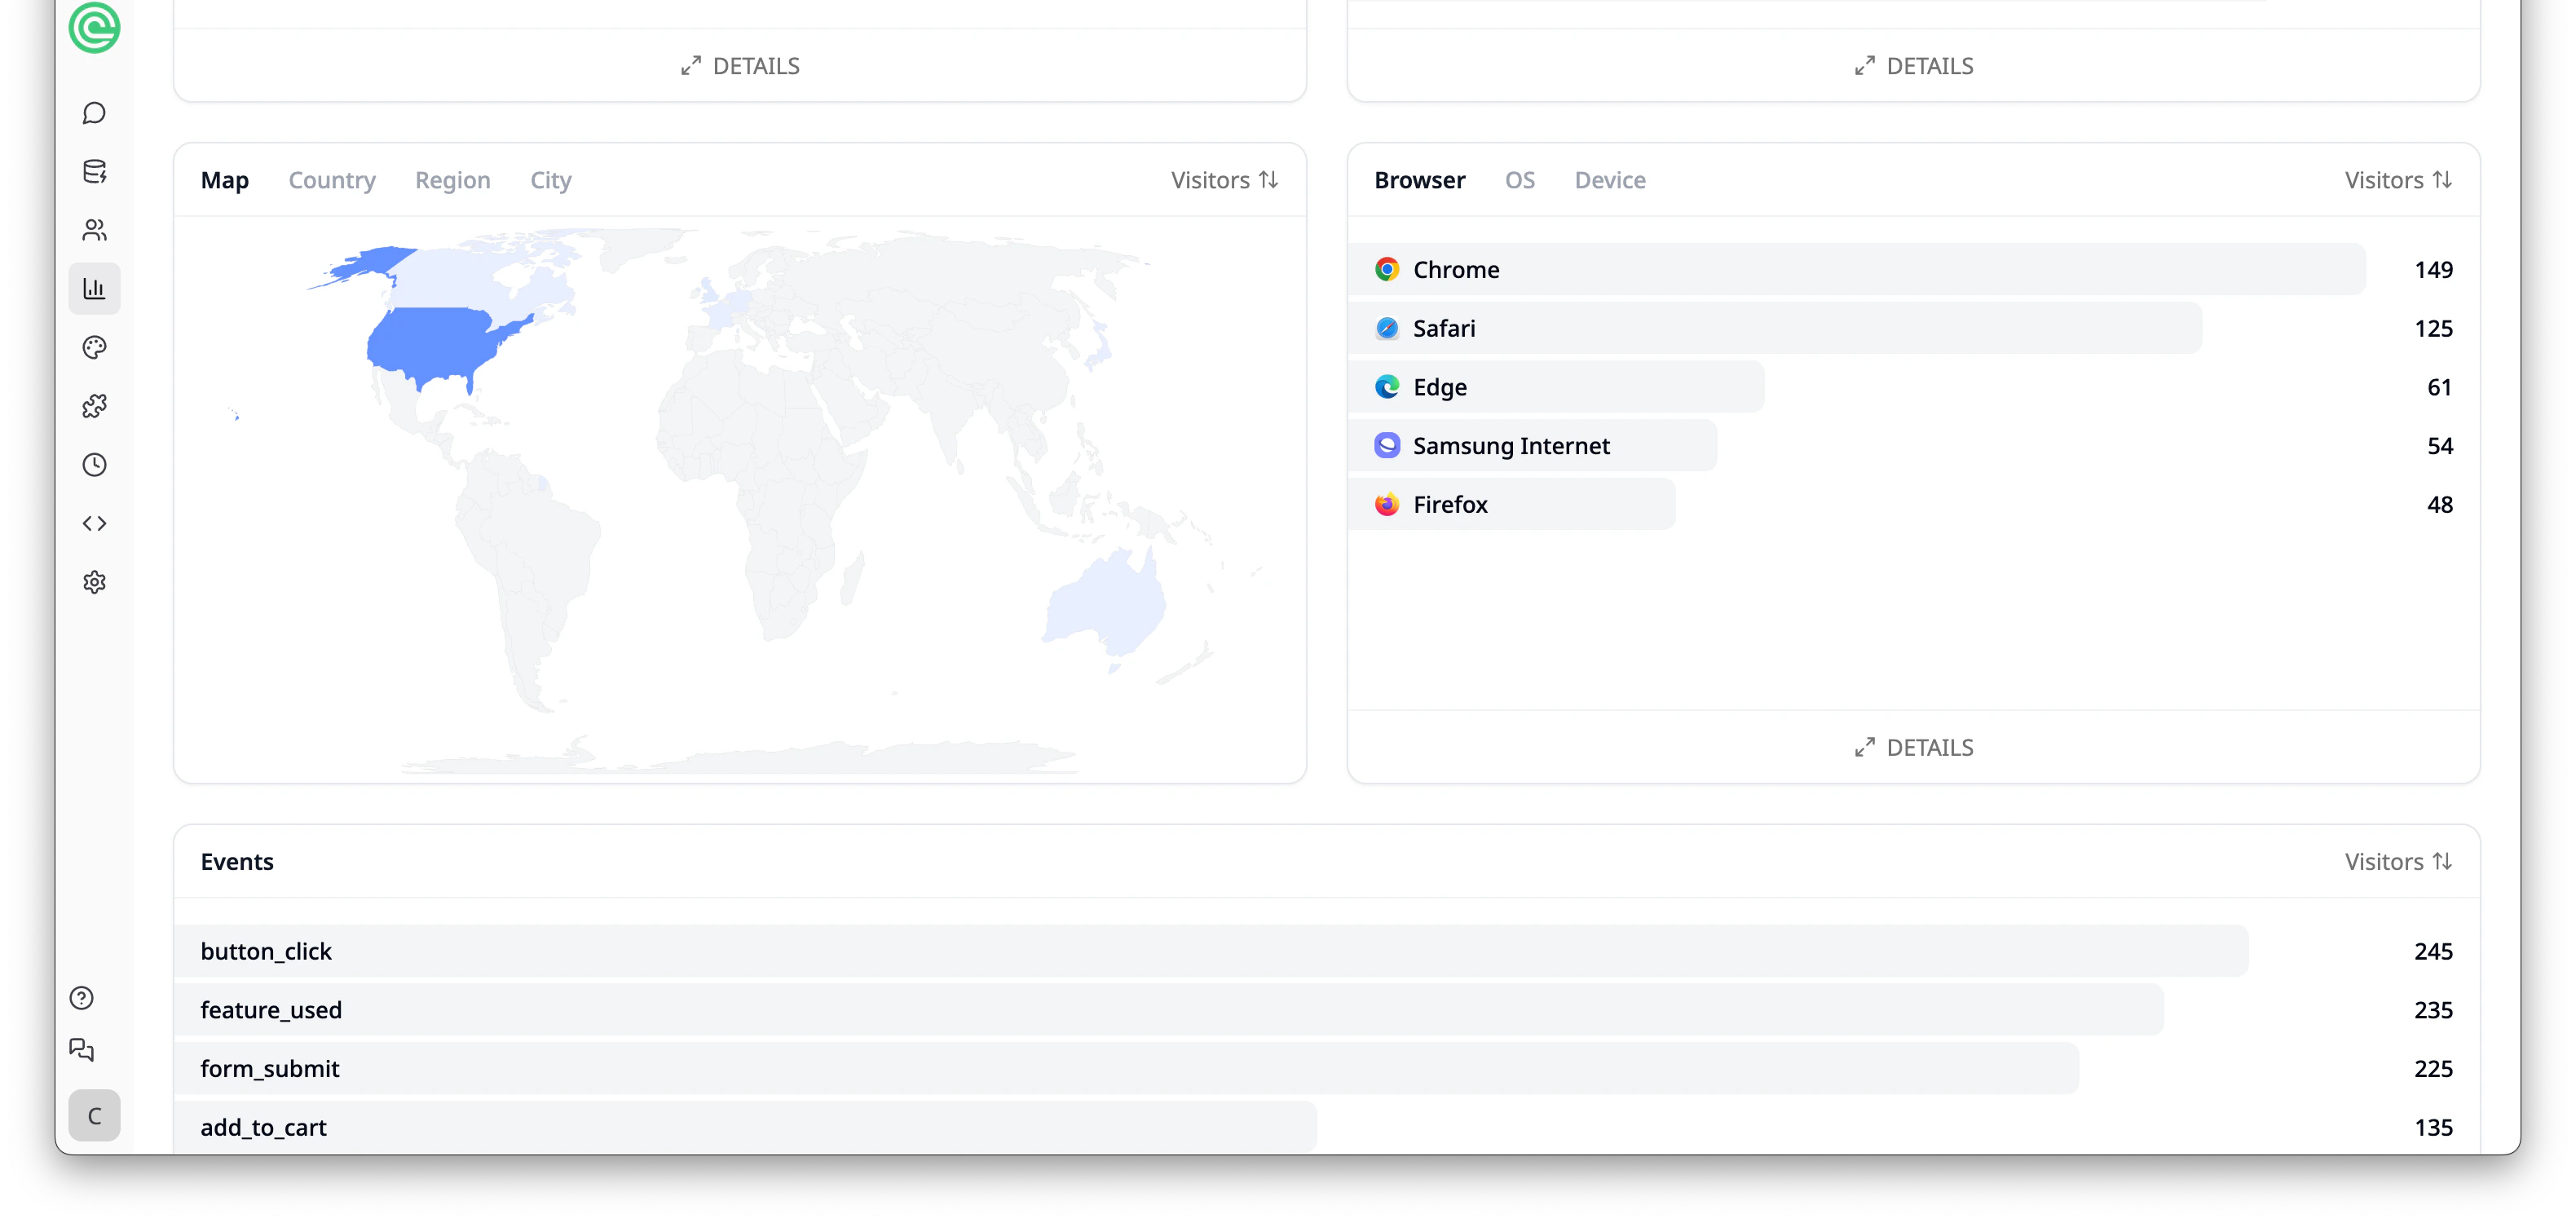
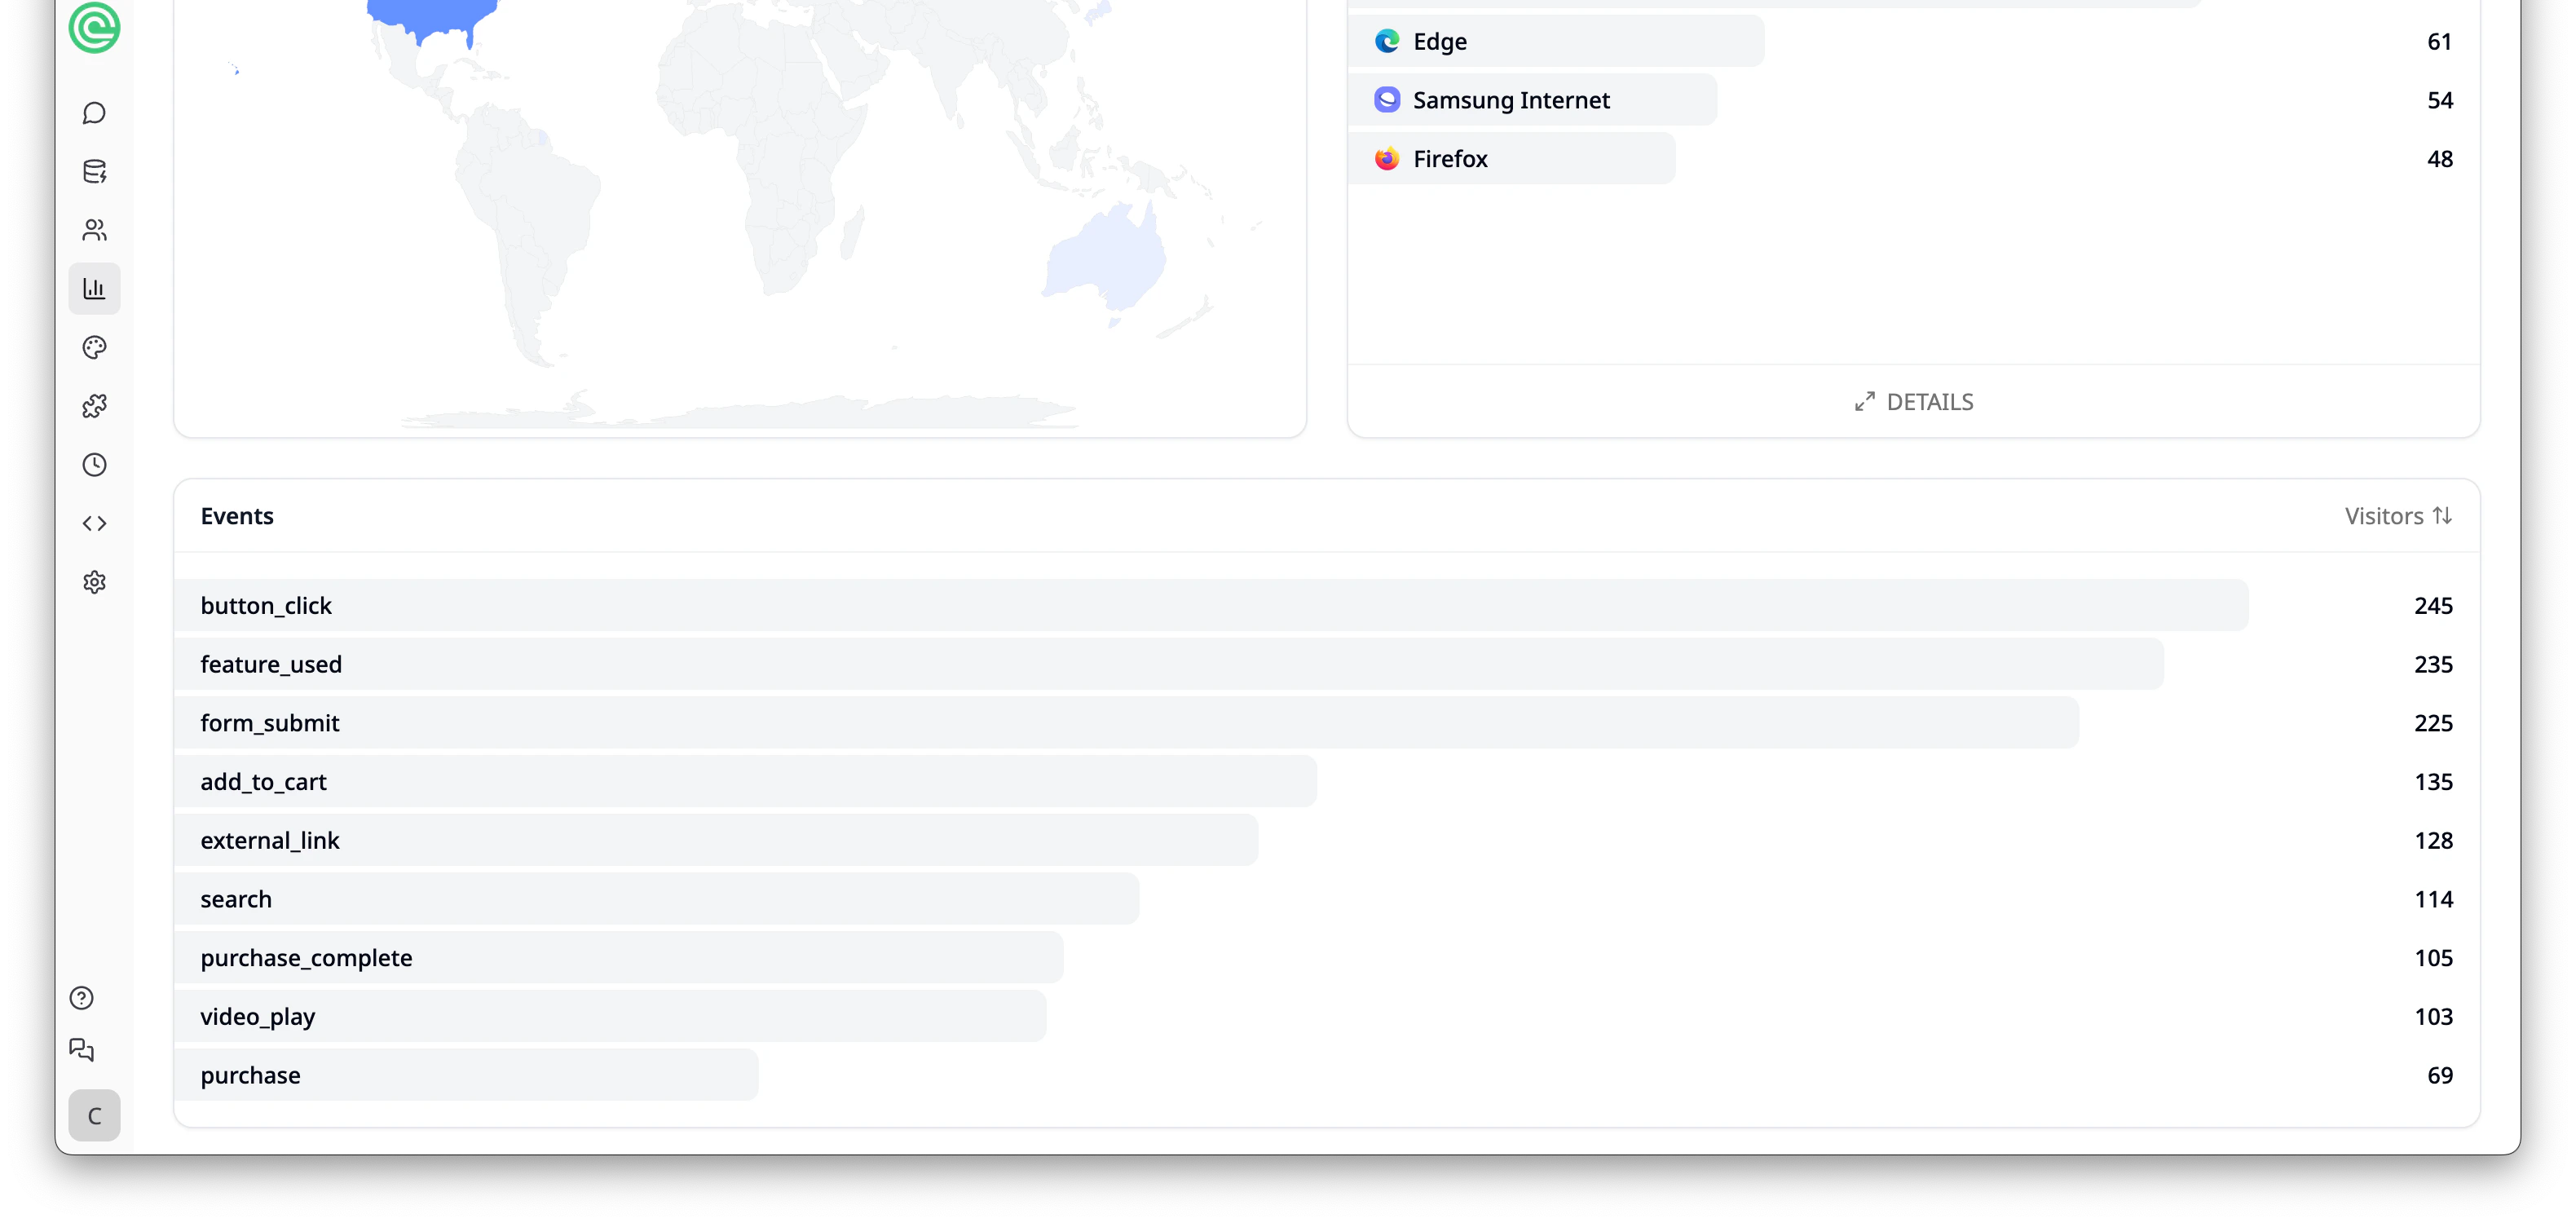
Custom Events
The Custom Events section tracks user interactions within your app. Each app will have its own set of custom events based on the features you’ve built. For example, an e-commerce app might track events likeadd_to_cart, purchase, and search, while a booking app might track session_booked or form_submit.
Use events to understand how visitors engage with your app and which features drive the most interaction.
Tips
- Check your dashboard regularly to spot trends - are more people using your app this week?
- Pay attention to bounce rate and session time to gauge how engaging your app is.
- Use the Channel breakdown to focus your marketing efforts on the highest-performing sources.
- Add UTM tags to links you share on social media or email, then check the Campaign tab to see which drive the most visitors.
- Monitor Custom Events to understand which features users engage with most.
Free plans include 7 days of web analytics history. Upgrade your plan for longer retention.